
Is This the Peak?
The war in Iran spiked energy prices, and now we are seeing them retreat. What that does for inflation, the Fed, and equity markets is the question that frames the quarter. In the meantime, artificial intelligence takes center stage, and we discuss the impact of the divergence between AI and software stocks.
Oil and inflation spiked. What happens now?
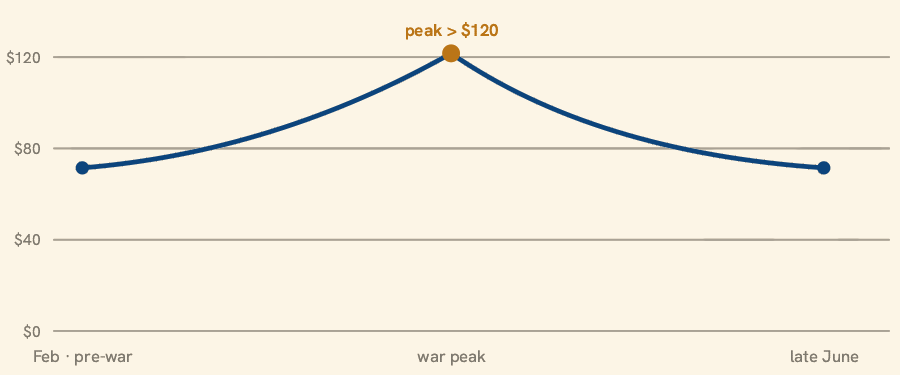
In the spring, the war in Iran sent crude oil above $120 a barrel and pushed headline inflation to a three-year high. Entering the third quarter, the war has cooled, and oil has round-tripped back toward where it started. One question influences everything that follows. Did the spike in oil leave a longer-term effect in higher core inflation, despite a newly hawkish Fed? And what does that mean for equity markets that have, so far, taken it all in stride?
We think the most likely path is a real but uneven thawing of tensions — relief at the pump that takes time to reach interest rates, and an economy that holds together despite what feels like a tentative environment. Our portfolios are invested for that base case, while keeping the flexibility to adapt if conditions change.
Oil's round trip
The defining move of the quarter was a reversal in oil prices. Brent crude, which traded near $72 before the war and spiked above $120 at the peak, fell back to roughly $72 by late June as a U.S.–Iran ceasefire held and tankers resumed transit through the Strait of Hormuz.1,2 Because energy drove more than 60% of May's inflation, that collapse should pull headline inflation lower through the back half of the year. May's 4.2% reading may well prove the peak.3,4
The catch is what the spike leaves behind. The ceasefire is fragile — sporadic drone attacks and stranded vessels are a reminder that the strait can re-close at any time. And core inflation, which strips out energy, did not spike and is not falling: it held at 2.9%, with shelter up 3.4%, and the Fed's preferred core gauge reached 3.4%, its highest since 2023.4,5 The oil spike may be receding, but the broader inflation underneath it is proving harder to bring down.
The Fed turns hawkish
On June 17, the Fed held its policy rate at 3.50%–3.75% for a fourth straight meeting — the first under new Chair Kevin Warsh.6 The decision was expected; the projections were not. In the "dot plot" — the chart of where each official expects rates to go — the median view flipped from a cut to a hike by year-end. Only one of eighteen participants still pencils in a cut this year, and seventeen of eighteen judge the risks to inflation to be tilted upward.7 Futures markets have followed, now pricing meaningful odds of a hike.8
The Fed has few tools against an energy shock — higher rates bring no more oil to market — so if crude's decline feeds through, the hawkish dots may never be realized. But with core inflation still sticky and a new Chair, "higher for longer" is our working assumption. In portfolios, we extend high-quality bond duration only gradually, positioning for an eventual fall in rates while respecting the risk of a hike.
A mixed picture for the consumer
On the surface, the labor market is firm. Employers added 172,000 jobs in May — roughly double what economists expected — and upward revisions to the prior two months made it the strongest three-month stretch of hiring in over two years. Unemployment held at 4.3% for a third straight month.9
Underneath, a different picture emerges. Pay is no longer keeping up with prices: average hourly earnings rose 3.4% over the past year while inflation ran at 4.2%, so real wages fell.10 And this is a low-hire, low-fire market — few layoffs, but those who lose a job are stuck looking. The share of the unemployed out of work for six months or longer has climbed to 27.5%, a high for this cycle.11
Households are feeling it. The Conference Board's confidence index sits near a nine-month low, and two-thirds of consumers report cutting back on spending because of prices.12 And increasingly, the economy is being carried less by the shopper and more by the corporation. In the first quarter, business investment out-drove consumer spending as the engine of growth for the first time on record — powered by the AI buildout we return to later.13
The two-tiered read of the economy: resilient enough that recession is not our base case, but uneven enough that we are not counting on it to last.
The market's two engines
Despite an act of war, a three-year inflation high, and a hawkish Fed, remarkably, U.S. equities have risen. At the time of this writing, the S&P 500 sits near 7,360, up roughly 13% since the end of the first quarter.14 Two forces explain it. The first is earnings — analysts expect about 23% profit growth in the second quarter and 24% for the full year. Those are ambitious numbers: roughly three times the ten-year average, and, unusually, a bar analysts have raised rather than cut as the year has gone on.15
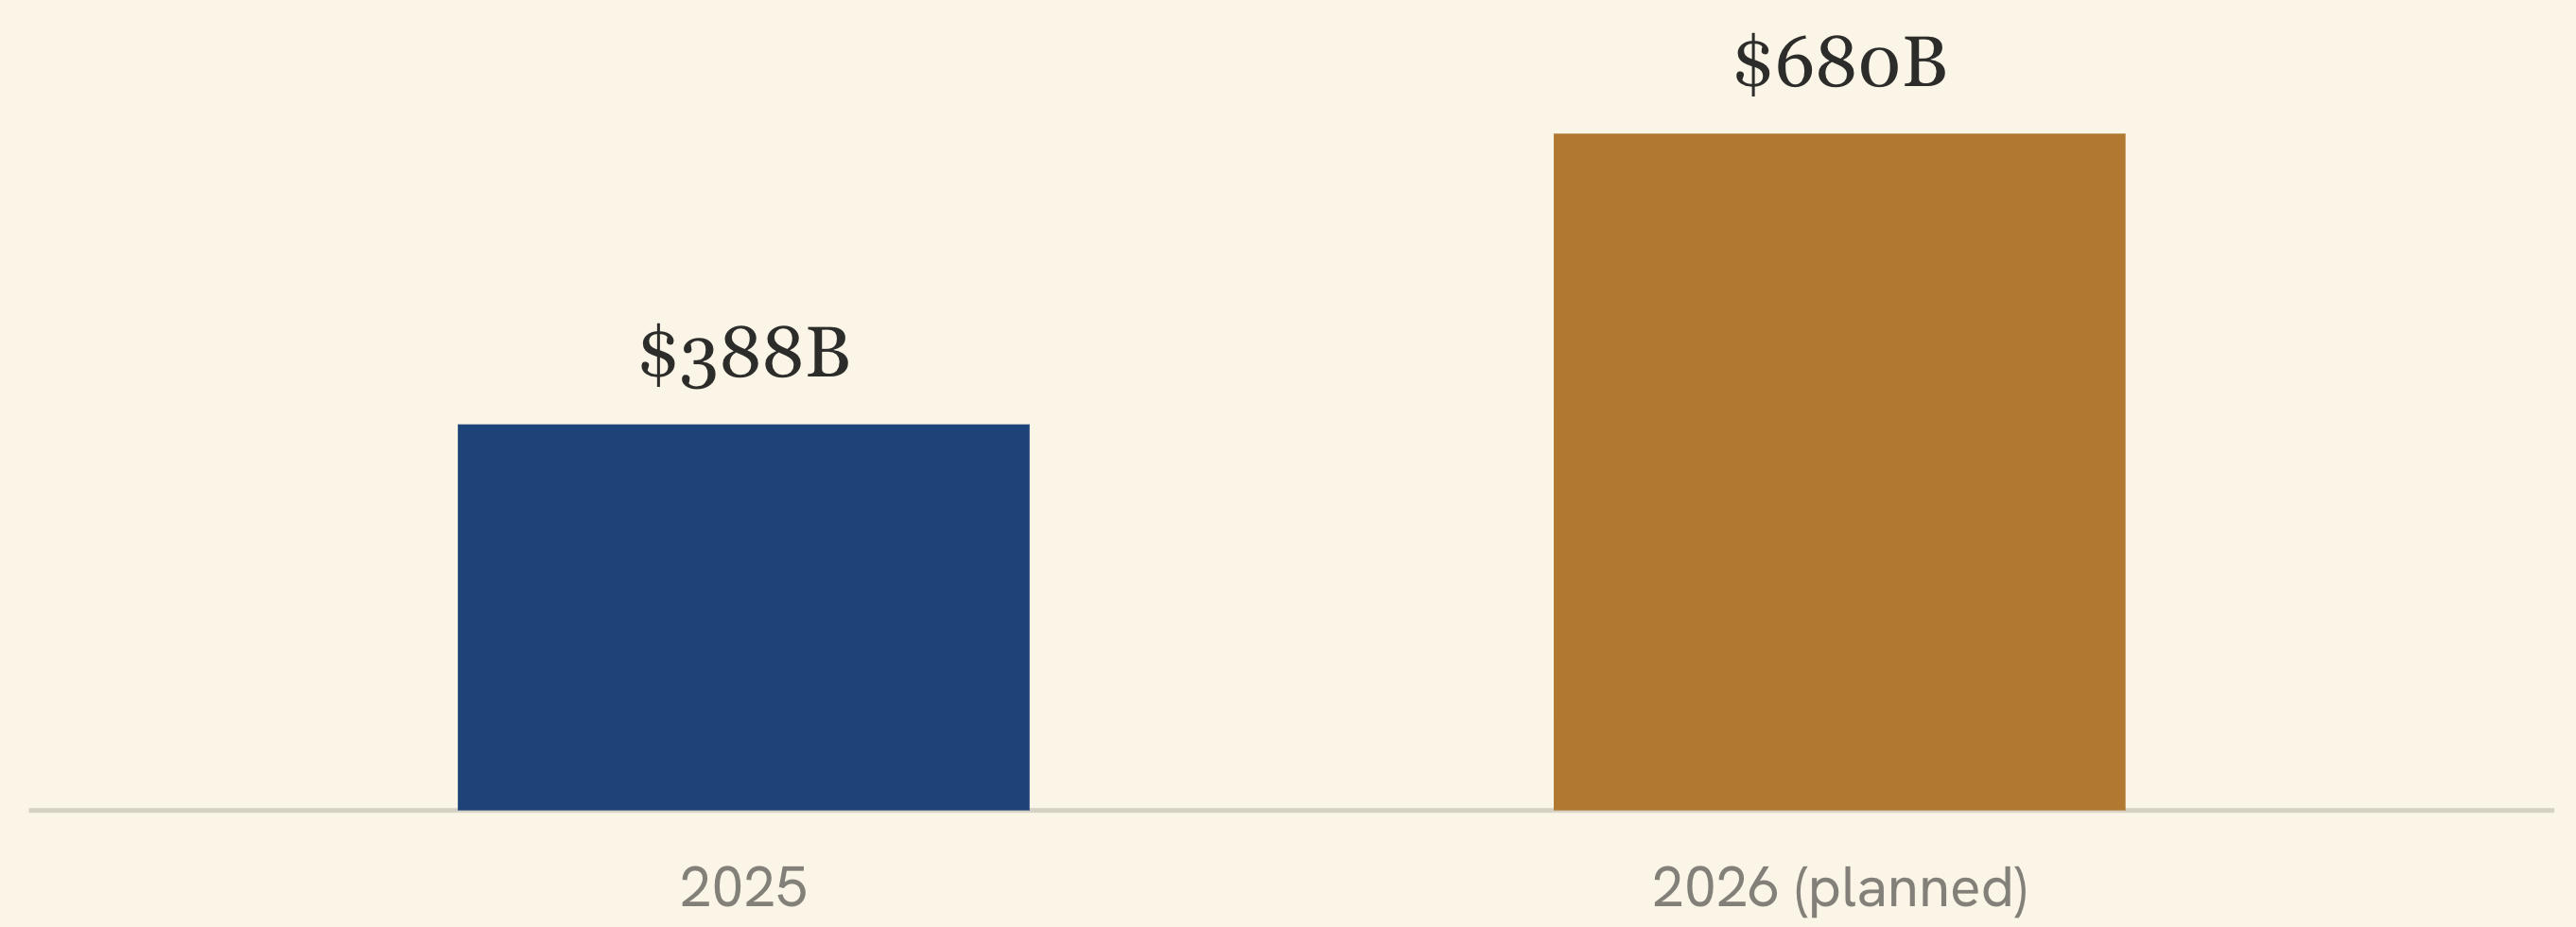
The second force is the engine beneath the index: the artificial-intelligence buildout. The five largest hyperscalers plan on the order of $680 billion in capital spending this year — nearly double last year, and the largest corporate investment cycle on record.16 That spending is what is holding up GDP even as the consumer pulls back, and it is lifting the handful of companies that dominate the index.
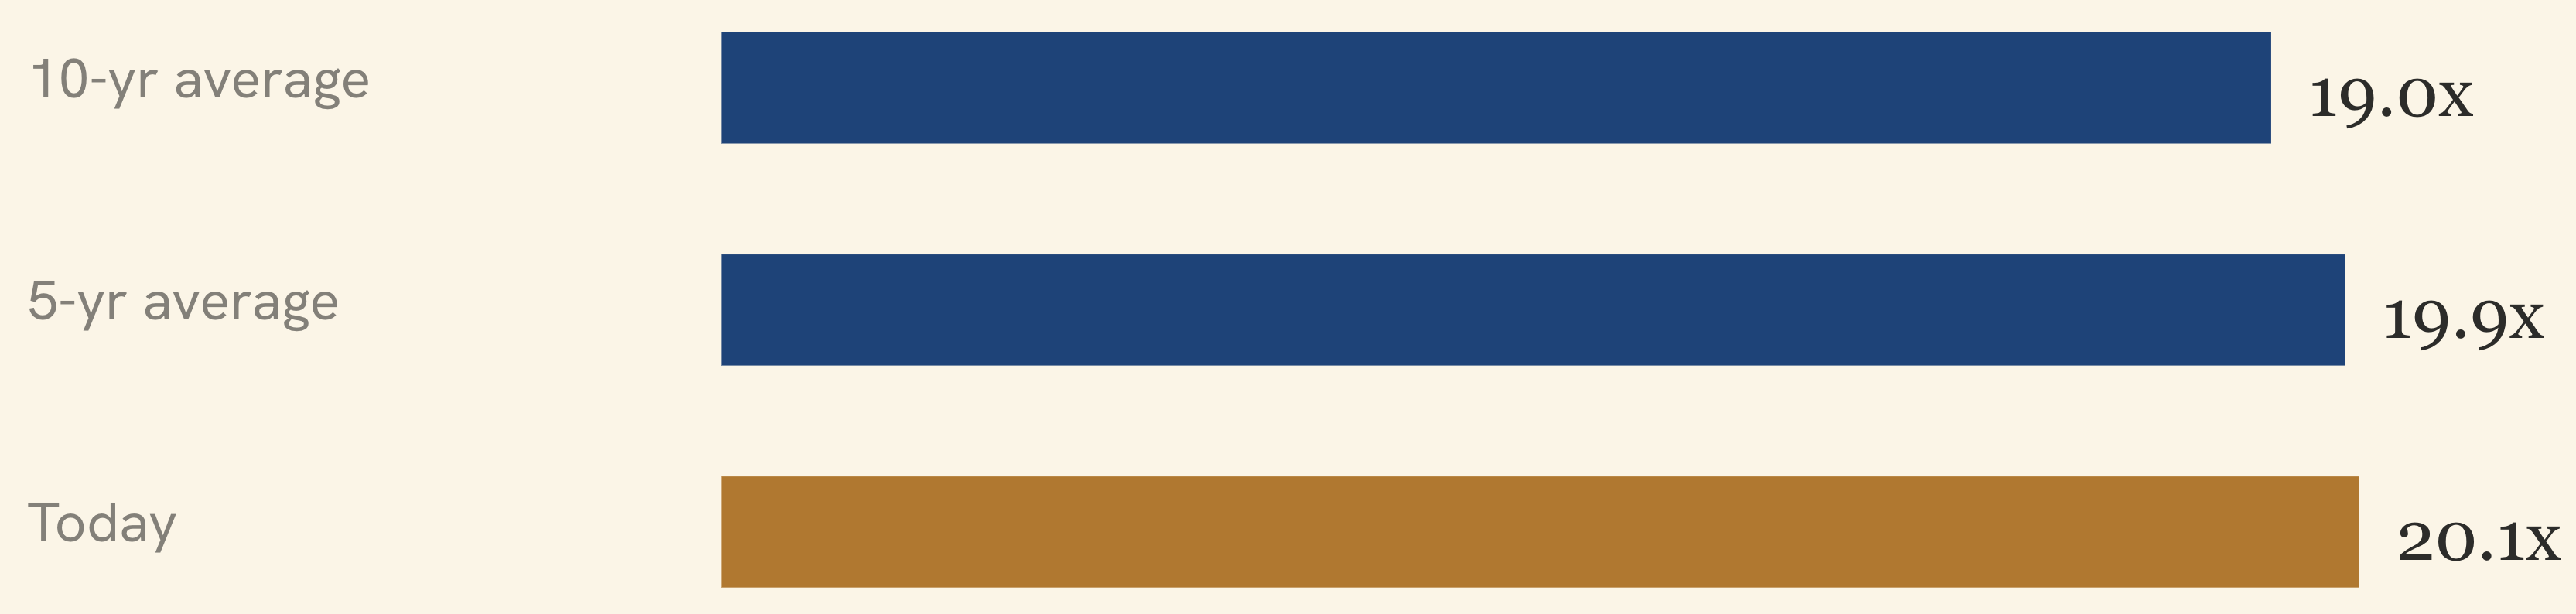
We believe in the long-term thesis of AI revolutionizing the world, and we want to participate in the benefits that come from it, as do nearly all investors. But valuations leave little room for missed expectations, if any — the forward multiple sits above its ten-year average and the trailing multiple is near 27x — and leadership is narrow, with a handful of mega-cap companies accounting for most of the index's gains.14 The risk is not that the buildout is fake — it plainly is not. It is that the returns on it disappoint, or that the capital spending itself falls short of today's projections. So while we still want the dominant names, which will remain central to how the world adopts this technology, we also want to own more of the picks and shovels — the power, infrastructure, and suppliers beneath the buildout — much as the surest profits in a gold rush went to those selling shovels.
Will AI eat software?
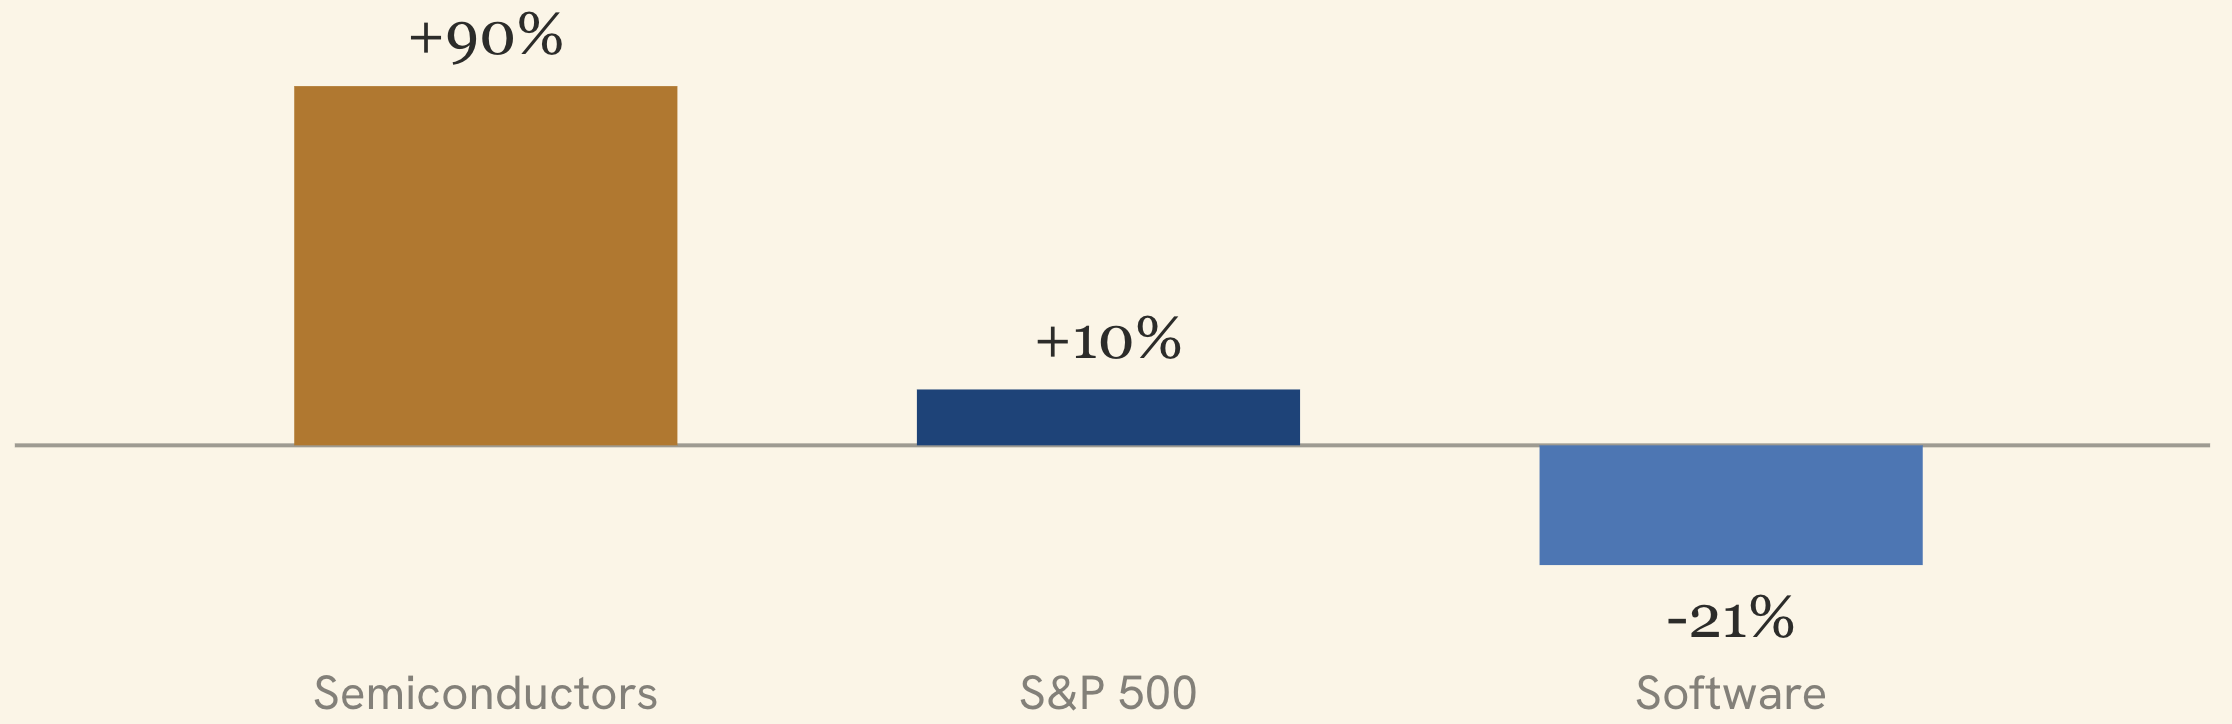
One of the biggest stories in the equity markets in 2026 has been a divergence: investors have bid up the makers of artificial intelligence and dumped the sellers of traditional software. The PHLX Semiconductor Index has nearly doubled this year, up about 90%, while the largest software ETF (IGV) has fallen about 21% year-to-date and roughly 30% from its 2025 peak. The S&P 500, for reference, is up about 10% year-to-date.17,18,19 The software sector has shed more than a trillion dollars in value; even Microsoft and Salesforce have fallen about a quarter since the start of the year. Wall Street has taken to calling it the "SaaSpocalypse."17
Investors fear the change is structural rather than cyclical. The thesis runs like this: AI agents can now do work that once required software licenses, and AI coding tools let companies build much of what they used to buy — so the market is repricing the durability of recurring software revenue. The software industry's forward multiple has fallen from the mid-30s to the low-20s, slipping below the S&P 500's own for the first time.20 Tellingly, the rewards have flowed to those who own the technologies, not those who merely apply them: even a pure-play AI name like Palantir, priced as software, fell about 40%.20
Is the logic sound? Directionally, yes — the shift is real. In degree, we think it has overshot. "AI kills software" is too broad: it rightly punishes companies whose functionality is easily copied, but proprietary data, deep integration, compliance, and customer trust remain hard to replicate — and many incumbents keep beating estimates even as their multiples compress. Positioning is also historically one-sided: by one gauge of how crowded a trade has become — how heavily investors are piled into it — chip stocks sit near the 99th percentile and software near the 23rd, the kind of extreme that often precedes a reversal.21
Our read: we favor the AI infrastructure and the durable, data-moated platforms. Crowded is not the same as overpriced — many technology leaders looked expensive for years and kept compounding — so we respect the chip trade even where it is crowded. What we most want to avoid is the value trap: a cheap-looking software name whose business is quietly eroding, the way Kodak looked cheap while digital cameras and the iPhone flourished, or Blockbuster looked a bargain just as Netflix rose and launched streaming. Guess how that turned out?
Five moves we're making
- Stay invested, neutrally positioned. We're not timing exits around a single inflation print. With the market solid but valuations full, we hold equities at a neutral weight — neither overweight nor underweight — rather than making a directional bet either way.
- Take advantage of higher yields. Rates sit well above where they were in recent years — the 10-year near 4.4%, the long bond at a multi-decade high — so high-quality bonds finally pay you to wait. We're capturing that yield and extending duration selectively; and if oil stays off its peak and inflation cools, rates should drift lower from here, lifting bond prices.22
- Keep a real-asset and energy sleeve. We like holding some real assets and energy in a diversified portfolio — for most investors, though not all. The conflict with Iran is not over and may not be fully resolved for some time, which remains a live risk to equity markets if the strait re-closes.
- Diversify beyond U.S. large-cap. We like owning some quality companies in developed foreign markets as a standing part of most risk-taking portfolios. The dollar has fallen roughly 10% against a basket of currencies over the past year, which has already rewarded that exposure — so we keep it, but we are not adding much on a tactical, short-term basis from here.23
- Hold a little dry powder. With valuations full, we carry slightly more cash than usual — not a market call, but the means to act on opportunities rather than chase them.
Markets have been calm and steady this year, and our base case does not call for that to change — but the ceasefire, the pace of the AI trade, and the health of the consumer are all worth watching. None is a cause for alarm; each is simply why investors should diversify, maintain an inflation hedge, and hold a little dry powder. If your circumstances have changed — a liquidity event, a shift in goals, a new obligation — that matters more than any forecast in this report. Reach out to your advisor, and we will talk about how to adjust your plan if necessary.
Every figure in this outlook is anchored to a dated, third-party source. Market levels are as of late June 2026 and are subject to revision.
- Brent and WTI crude prices, late June 2026 — Brent ~$72 (lowest since Feb. 27), down from a war peak above $120; CNBC; Trading Economics.
- U.S.–Iran interim ceasefire and Strait of Hormuz reopening; Persian Gulf exports ~75% of pre-war levels; re-escalation risk noted; CNBC.
- U.S. Bureau of Labor Statistics, Consumer Price Index — May 2026: headline +4.2% y/y (highest since April 2023), +0.5% m/m; core +2.9% y/y; bls.gov; CNBC.
- BLS CPI, May 2026 — energy +23.5% y/y (gasoline +40.5%), shelter +3.4%; energy >60% of the monthly increase; bls.gov; JPMorgan Chase.
- U.S. Bureau of Economic Analysis, PCE price index, May 2026 (released June 26) — headline +4.1%, core +3.4% (highest since 2023); via Trading Economics.
- Federal Reserve, FOMC statement, June 17, 2026 — target range held at 3.50%–3.75% (fourth consecutive meeting; first under Chair Kevin Warsh); federalreserve.gov.
- Federal Reserve, June 2026 Summary of Economic Projections ("dot plot"); analysis via Lord Abbett and StockTitan — median 2026 dot shifted from a cut to a hike; 1 of 18 participants projected a cut; 17 of 18 saw upside inflation risk.
- Rate-hike expectations, late June 2026 — futures markets pricing meaningful odds of a hike after the June dot plot; CME FedWatch; StreetStats; Chase.
- BLS, Employment Situation, May 2026 — +172,000 payrolls; unemployment 4.3%; prior two months revised up by 93,000; bls.gov; Bloomberg.
- BLS — average hourly earnings +3.4% over the year to May 2026, below CPI inflation of +4.2%; real wages fell over the period; bls.gov.
- BLS — long-term unemployed (27+ weeks) at 27.5% of the unemployed, a cycle high, up 524,000 y/y; bls.gov.
- The Conference Board, Consumer Confidence Index — 93.1 (May 2026), near a nine-month low; ~two-thirds of consumers cutting back; conference-board.org.
- U.S. Bureau of Economic Analysis, Q1 2026 GDP (advance estimate) — business investment contributed 1.48 percentage points to 2.0% real GDP growth versus consumer spending's 1.08, the first time business investment was the larger driver; consumer spending was 68.1% of GDP; via Yahoo Finance; LPL Financial.
- FactSet Earnings Insight, June 2026 — S&P 500 ~7,357 (June 25), +12.7% since March 31; forward 12-month P/E 20.1x vs. 10-yr avg 19.0x; trailing P/E 27.3x.
- FactSet Earnings Insight (late June 2026) — estimated S&P 500 earnings growth of +23.1% (Q2 2026) and +24.0% (CY 2026); roughly 3x the trailing 10-year average of ~8.6%; the CY2026 estimate was revised up from ~15.6% in January, an unusual mid-year increase.
- Hyperscaler 2026 capital-expenditure plans — five largest providers ~$660–725B combined, nearly double 2025, ~75% AI-directed; Futurum Group; CreditSights; AL Capital Advisory.
- Software sell-off ("SaaSpocalypse") — iShares Expanded Tech-Software ETF (IGV) down ~21% YTD 2026 and ~30% below its Sept. 2025 peak; sector market value down >$1 trillion; term coined by Jefferies' J. Favuzza; Forbes/AInvest; SaaStr; tech-insider.org.
- Semiconductors — PHLX Semiconductor Sector Index up ~90% YTD 2026 (per its tracking ETF, as of late June); Nvidia reached ~$5.5 trillion in May, the first company ever to do so before easing back; Nasdaq; Yahoo Finance / Zacks; Forbes; CNBC.
- S&P 500 up ~10% YTD 2026 (price return, through late June); J.P. Morgan Wealth Management / Chase.
- Software forward P/E fell from the mid-30s to the low-20s, below the S&P 500's for the first time; 2026 YTD declines include Microsoft ~−25%, Salesforce ~−26%, Palantir ~−40%; Advisor Perspectives (Daily Shot); Forbes/AInvest; tech-insider.org.
- Positioning & drivers — J.P. Morgan crowding model placed semiconductors near the 99th percentile and software near the 23rd; agentic tools (e.g., Claude Code, Claude Cowork, OpenAI Frontier) drove the re-rating; short sellers earned >$20B on software in 2026; TechFlow; KuCoin; Betterment; Oliver Wyman; Forbes.
- U.S. Treasury yields, late June 2026 — 10-year near 4.4% and 30-year having touched 5.20% on May 19 (highest since 2007), both well above the prior decade's range; U.S. Treasury; Trading Economics.
- U.S. dollar down roughly 10% against a basket of major currencies over the past year — the Dollar Index fell ~11% in the first half of 2025 (its steepest such drop since 1973), sliding from a January-2025 peak above 109 to about 99–101 by mid-2026; Morgan Stanley; Morningstar; Federal Reserve (Broad Dollar Index).
Affiliation. Kento Wealth Advisors is affiliated with Wells Fargo Advisors Financial Network (WFAFN), an independent broker-dealer model. Required WFAFN / FINRA / SIPC membership notices and the firm's Form CRS and Form ADV references are to be supplied and approved by WFAFN compliance prior to distribution. Do not circulate externally until that approved wording is in place.
Not investment advice. This material is provided for informational and educational purposes only. It is not a recommendation, an offer, or a solicitation to buy or sell any security or to adopt any investment strategy, and it does not constitute investment, legal, or tax advice. Any positioning described reflects the firm's general views as of the date of publication and is not tailored to the circumstances of any particular client.
Forward-looking statements. Statements about the economy, markets, and portfolio positioning are based on assumptions and current expectations, involve known and unknown risks and uncertainties, and may not come to pass. Actual results may differ materially. The firm undertakes no obligation to update any forward-looking statement.
Data & sources. Figures are drawn from the third-party sources cited above and are believed to be reliable as of late June 2026, but their accuracy and completeness are not guaranteed. Economic and market data are subject to revision. Charts are illustrative; where noted, certain values are approximate and anchored to the cited data points.
Risk. All investing involves risk, including the possible loss of principal. Past performance is not a guarantee of, and may not be indicative of, future results. Diversification and asset allocation do not ensure a profit or protect against loss in a declining market. Fixed-income investments are subject to interest-rate, credit, and inflation risk; bond prices generally fall as rates rise. Investments in commodities and energy may be more volatile than other investments.
Confidentiality. Prepared for clients of Kento Wealth Advisors. Please do not redistribute.
S&P 500 Index is a capitalization-weighted index calculated on a total return basis with dividends reinvested. The index includes 500 widely held U.S. market industrial, utility, transportation and financial companies.
Wells Fargo Advisors Financial Network did not assist in the preparation of this report, and its accuracy and completeness are not guaranteed. The report herein is not a complete analysis of every material fact in respect to any company, industry or security. The opinions expressed here reflect the judgment of the author as of the date of the report and are subject to change without notice. Any market prices are only indications of market values and are subject to change. The material has been prepared or is distributed solely for information purposes and is not a solicitation or an offer to buy any security or instrument or to participate in any trading strategy. Additional information is available upon request.
Investment products and services are offered through Wells Fargo Advisors Financial Network, LLC (WFAFN), Member SIPC. Kento Wealth Advisors of Maeder Wealth Group is a separate entity from WFAFN.
Kento Wealth Advisors · Quarterly Investment Outlook · Q3 2026. Wealth Aligned by Design. · kentowealth.com · © 2026 Kento Wealth Advisors. Prepared for clients of Kento Wealth Advisors. Not a solicitation or an offer to buy or sell any security.