
Is 5% the New Normal?
The 10-year Treasury yield rose 85 basis points in a single quarter, to a level last seen in 2007, and the Federal Reserve raised its policy rate for the first time since 2023. While that was uncomfortable for anyone holding long bonds, a 10-year Treasury above 5% is closer to normal than the decade that came before it. We look at what the move in rates is telling us about inflation, why corporate earnings have held up anyway, where we see early signs of excess, and why we favor a tilt toward liquid assets and a little patience as the year closes.

Rates jumped. Stocks barely blinked.
Entering the fourth quarter, the 10-year Treasury yield sits above 5% for the first time since 2007, the Federal Reserve has raised rates for the first time since 2023, and the S&P 500 is within a few points of a record.1,2,3 Those three facts may fit together more comfortably than they first appear. In our view, the most likely explanation is that markets expect growth strong enough to rekindle inflation: bond yields appear to be pricing the inflation that such growth could bring, while stocks appear to be pricing the growth itself. The challenge for equities is that, if yields stay this high, the hurdle stocks must clear to justify their risk rises with them. In our view, the overall picture looks good. Our position is that we still want at least moderate exposure to the stock market where it makes sense for clients, but we are keeping a careful eye on the balance between bond yields, corporate earnings, and the trajectory of Fed decisions.
A word on our prior outlook. We wrote in July that our working assumption was that the Fed would keep its policy rate higher for longer rather than begin cutting, and that May’s 4.2% inflation reading might prove the peak. Both played out: the Fed has since raised rates rather than lowered them, and headline inflation has eased to 3.4%.2,4 We also thought oil’s retreat could feed through to lower bond yields. Instead, hostilities with Iran resumed, Brent crude climbed back above $100, and the 10-year yield rose 85 basis points in a quarter – which is why we added duration only gradually, and why the pages that follow begin with rates.5,6
The Whole Curve Lifted
In the third quarter, the Treasury curve did not steepen so much as rise in place. According to the U.S. Treasury, the 2-year yield climbed from 4.14% to 4.88%, the 10-year from 4.44% to 5.29%, and the 30-year from 4.91% to 5.64%.6 The gap between 2- and 10-year yields widened only modestly, from 30 to 41 basis points, so most of what the bond market seemed to be saying this summer was about the level of rates rather than their shape.
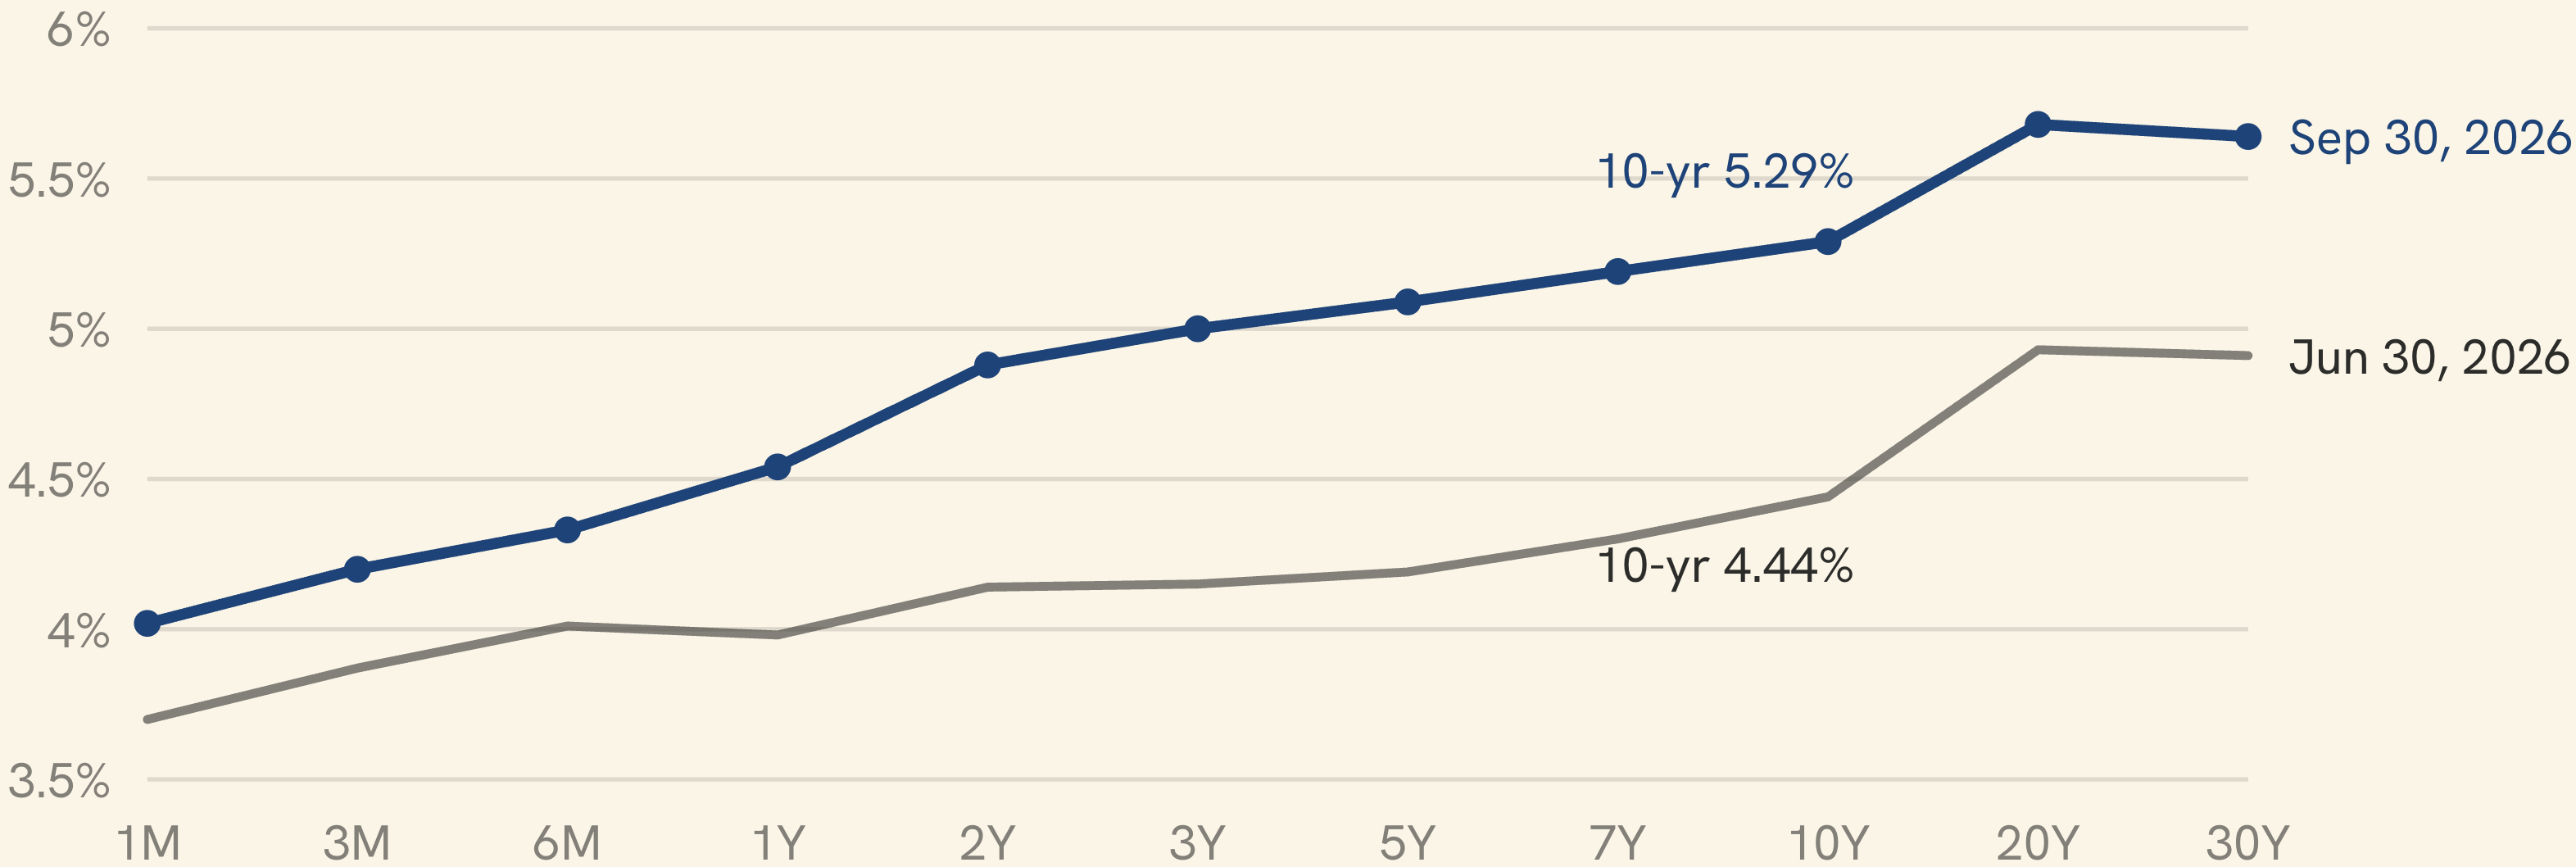
Why did yields keep rising even after a weak September jobs report cut the odds of an October hike to about one in six?7 We think it is because the Fed is only part of the story. Sticky inflation, a recurring oil shock, and heavy Treasury issuance appear to be among the factors contributing to a higher term premium – the extra compensation investors demand for lending long – so rates moved for reasons the Fed does not fully control.8 That is one reason they may not fall when the Fed pauses.
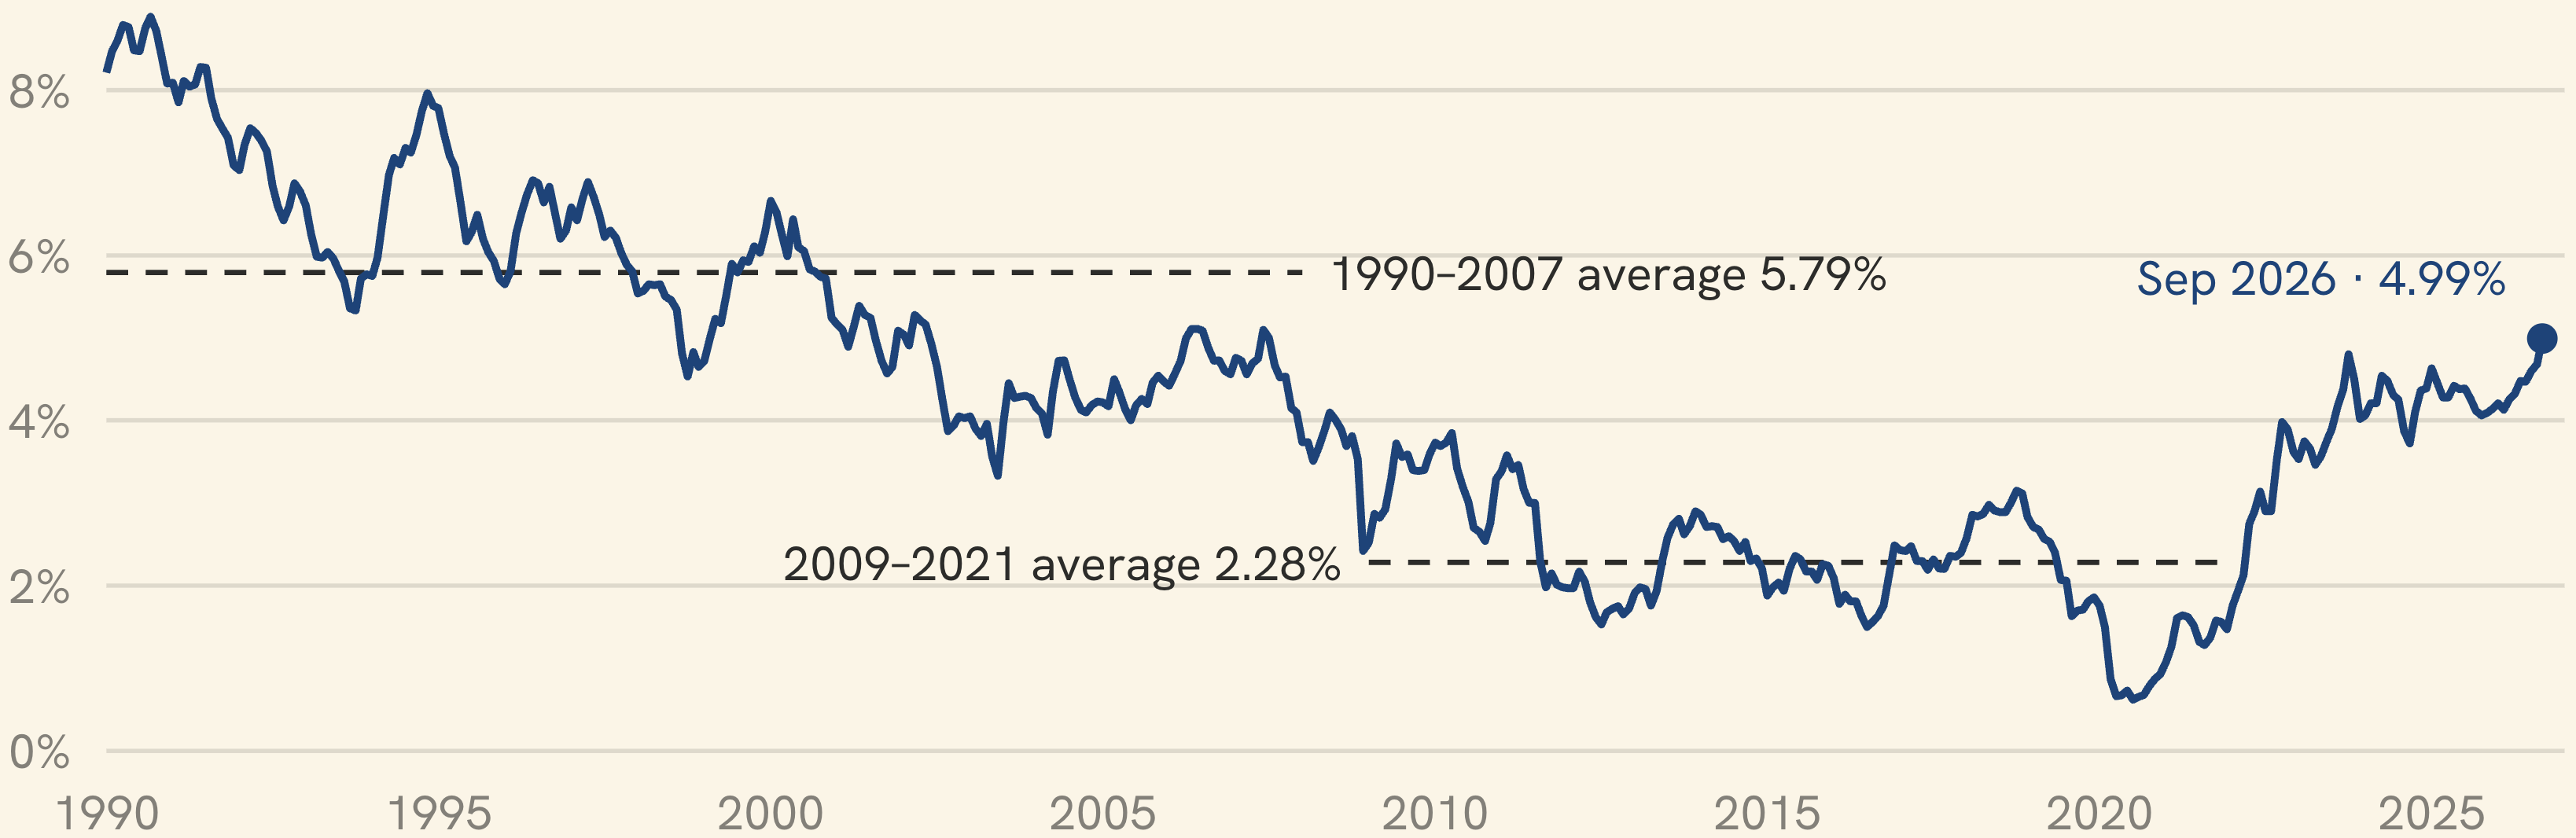
The monthly data kept by the Federal Reserve show the 10-year averaged 5.79% from 1990 through 2007, and 2.28% from 2009 through 2021.9 September’s 4.99% average was the first reading near 5% since July 2007, yet well over half of the months between 1990 and 2007 saw the 10-year above today’s level.9 By that measure, we believe it is the zero-rate decade that was abnormal, not this one. For portfolios, bonds may once again be able to pay income and cushion equity risk, provided their maturities and credit quality are chosen with care.
Cooler, Not Cool
Although the headline numbers have improved, the Fed hiked anyway, and we think it was right to be concerned. The Bureau of Labor Statistics reported that consumer prices rose 3.4% over the 12 months to August, while core inflation, which strips out food and energy, slowed to 2.4%, its lowest since 2021.4 The Fed’s preferred gauge, core PCE inflation, sits at 3.0% according to the Bureau of Economic Analysis, a full point above target.10 Gasoline is up 27.4% from a year ago, and the Institute for Supply Management’s prices-paid index – a monthly survey of how many manufacturers are paying more for their materials than they were the month before – jumped nearly 10% in September, a sign that manufacturers may once again be passing costs along.4,11
On September 16 the Federal Open Market Committee raised its target range a quarter point, and Chair Kevin Warsh said inflation “is too high and has been for too long.”2 The minutes released on October 7 confirmed that most officials saw another move as likely by year-end.7 Energy helps explain the urgency. The Energy Information Administration reports Brent crude averaged $114 a barrel in September after an attack on a Saudi pipeline sent spot prices to $131, and it expects prices near $105 through the fourth quarter.5 Higher rates bring no more oil to market, but they may keep a second round of price increases from taking root. That appears to be the bet the Fed is making.
We do not expect inflation to re-accelerate the way it did in 2022, as the underlying core trend is better than the headline suggests. Based on current conditions, we believe the case for meaningful rate cuts in 2027 remains limited, and the Fed’s own median projection agrees.2 If energy prices retreat and core inflation keeps grinding lower, yields could settle somewhat below today’s levels. If the Strait of Hormuz stays contested, a second hike this year becomes more likely, and the long end of the curve would likely bear the cost. Of those two paths, we think portfolios should be built to withstand the less comfortable one – a longer standoff, another hike, and more pressure on long-term bonds – rather than count on the first.
Floating-Rate and Inflation-Protected Bonds in Today’s Rate Environment
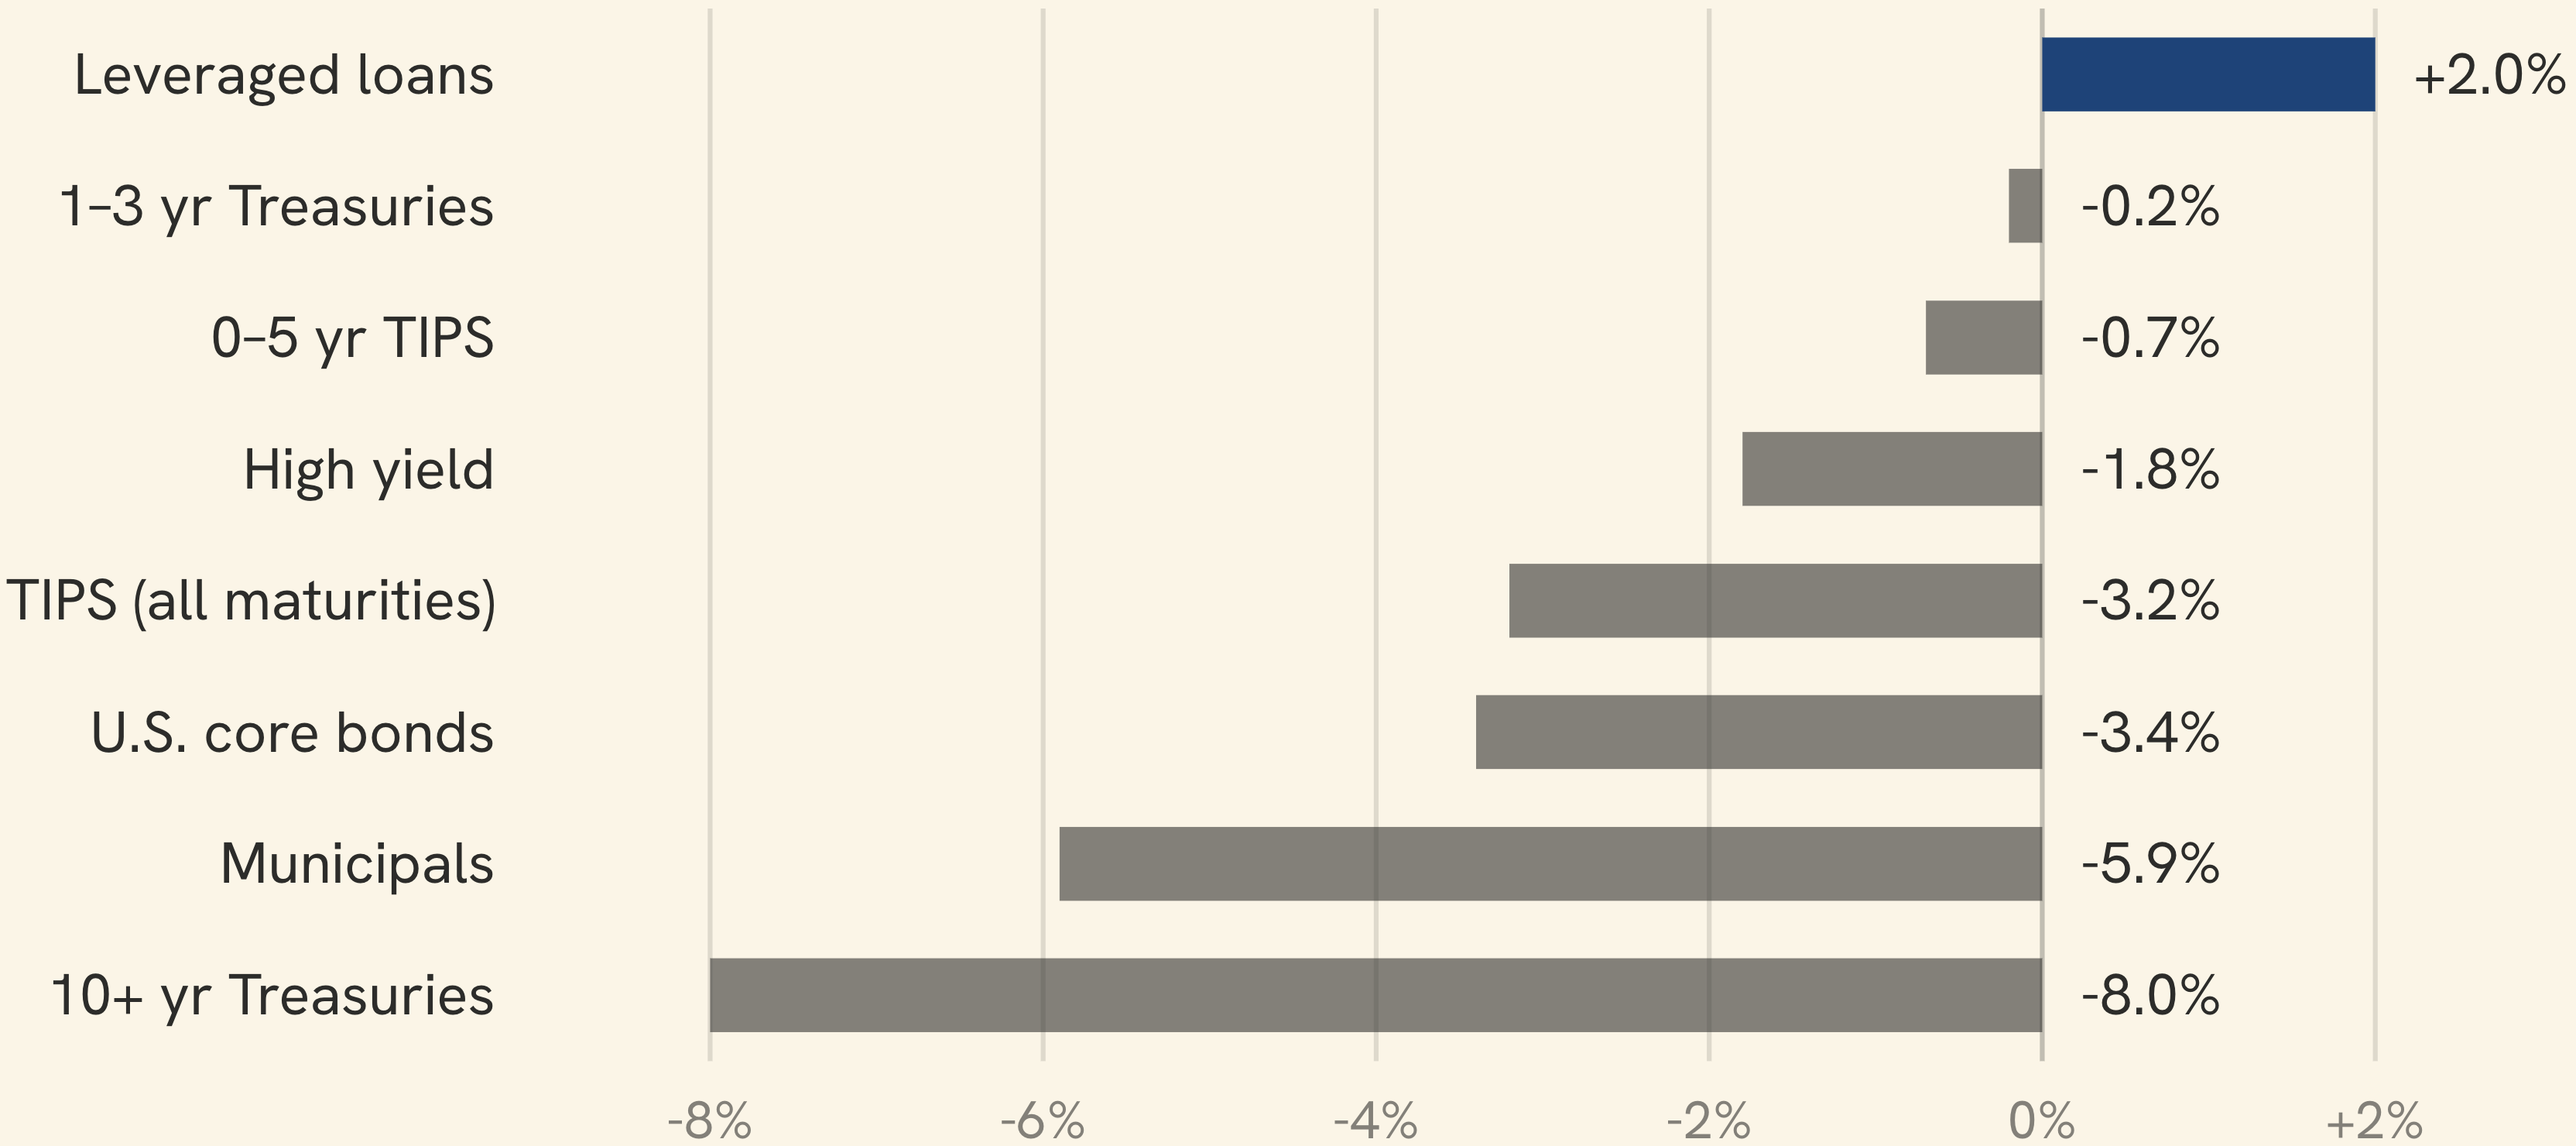
Especially for investors whose portfolios lean toward bonds, the quarter was a reminder of where maturity matters: not in whether a bond’s payments will be made, which largely depends on the quality of the borrower, but in what its price does along the way. The longer the maturity, the bigger the swing in price when interest rates move, and the more that can happen between the day a bond is bought and the day it comes due. According to Morningstar index data, the broad U.S. investment-grade bond market fell 3.4%, Treasuries maturing in 10 years or more lost 8.0%, and municipal bonds fell 5.9%, while high yield gave up only 1.8% and Treasuries maturing within three years were essentially flat, down 0.2%.12,13 One corner of the market finished in the black: the Morningstar LSTA index of leveraged loans gained 2.0%, because its coupons float.12
A floating-rate instrument resets its interest payment on a schedule – Treasury floating-rate notes off the latest 13-week bill auction, bank loans off the overnight benchmark rate plus a spread – meaning that when short-term rates rise, the coupon rises with them and the price tends to move far less. For some clients, particularly those with bond-heavy allocations, we believe a modest sleeve of floating-rate exposure may help reduce sensitivity to further increases in short-term interest rates. For others, keeping maturities short and letting today’s higher yields do the work is response enough. A distinction matters here. As existing bonds mature and the proceeds are reinvested, we may go a little further out on the curve to capture today’s higher yields. What we are not doing, in general, is selling shorter and intermediate bonds to move out to the longest maturities.
Treasury Inflation-Protected Securities, or TIPS, are the other tool in this kit: their principal is adjusted with the consumer price index, so they pay more if inflation runs hotter than expected. They are not immune to rising rates – the broad TIPS market fell 3.2% in the third quarter as yields rose, although a short-maturity version lost only 0.7% – but for clients concerned about a second round of inflation, we think a measured allocation to shorter-dated TIPS alongside floating-rate bonds is a sensible complement.14
Few Hires, Fewer Layoffs
The economy is growing, but hiring has slowed to a trickle. The Bureau of Labor Statistics reported that employers added just 29,000 jobs in September, well below the 84,000 economists expected, and revised the prior two months down by a combined 60,000. The unemployment rate edged up to 4.2%, still inside the narrow range it has held all year.15 Wages are the softer spot: average hourly earnings rose 3.0% over the year, the slowest since 2021 and below the 3.4% rate of inflation.4,15
Growth, meanwhile, is respectable. The Bureau of Economic Analysis revised second-quarter GDP up to a 2.2% annual rate, and the Institute for Supply Management’s manufacturing index – a monthly survey in which a reading above 50 means more factories report business picking up than slowing down – has sat above 54 for three consecutive months, a level that signals steady expansion.11,16 Taken together, these measures describe a low-hire, low-fire economy.
Earnings Do the Heavy Lifting
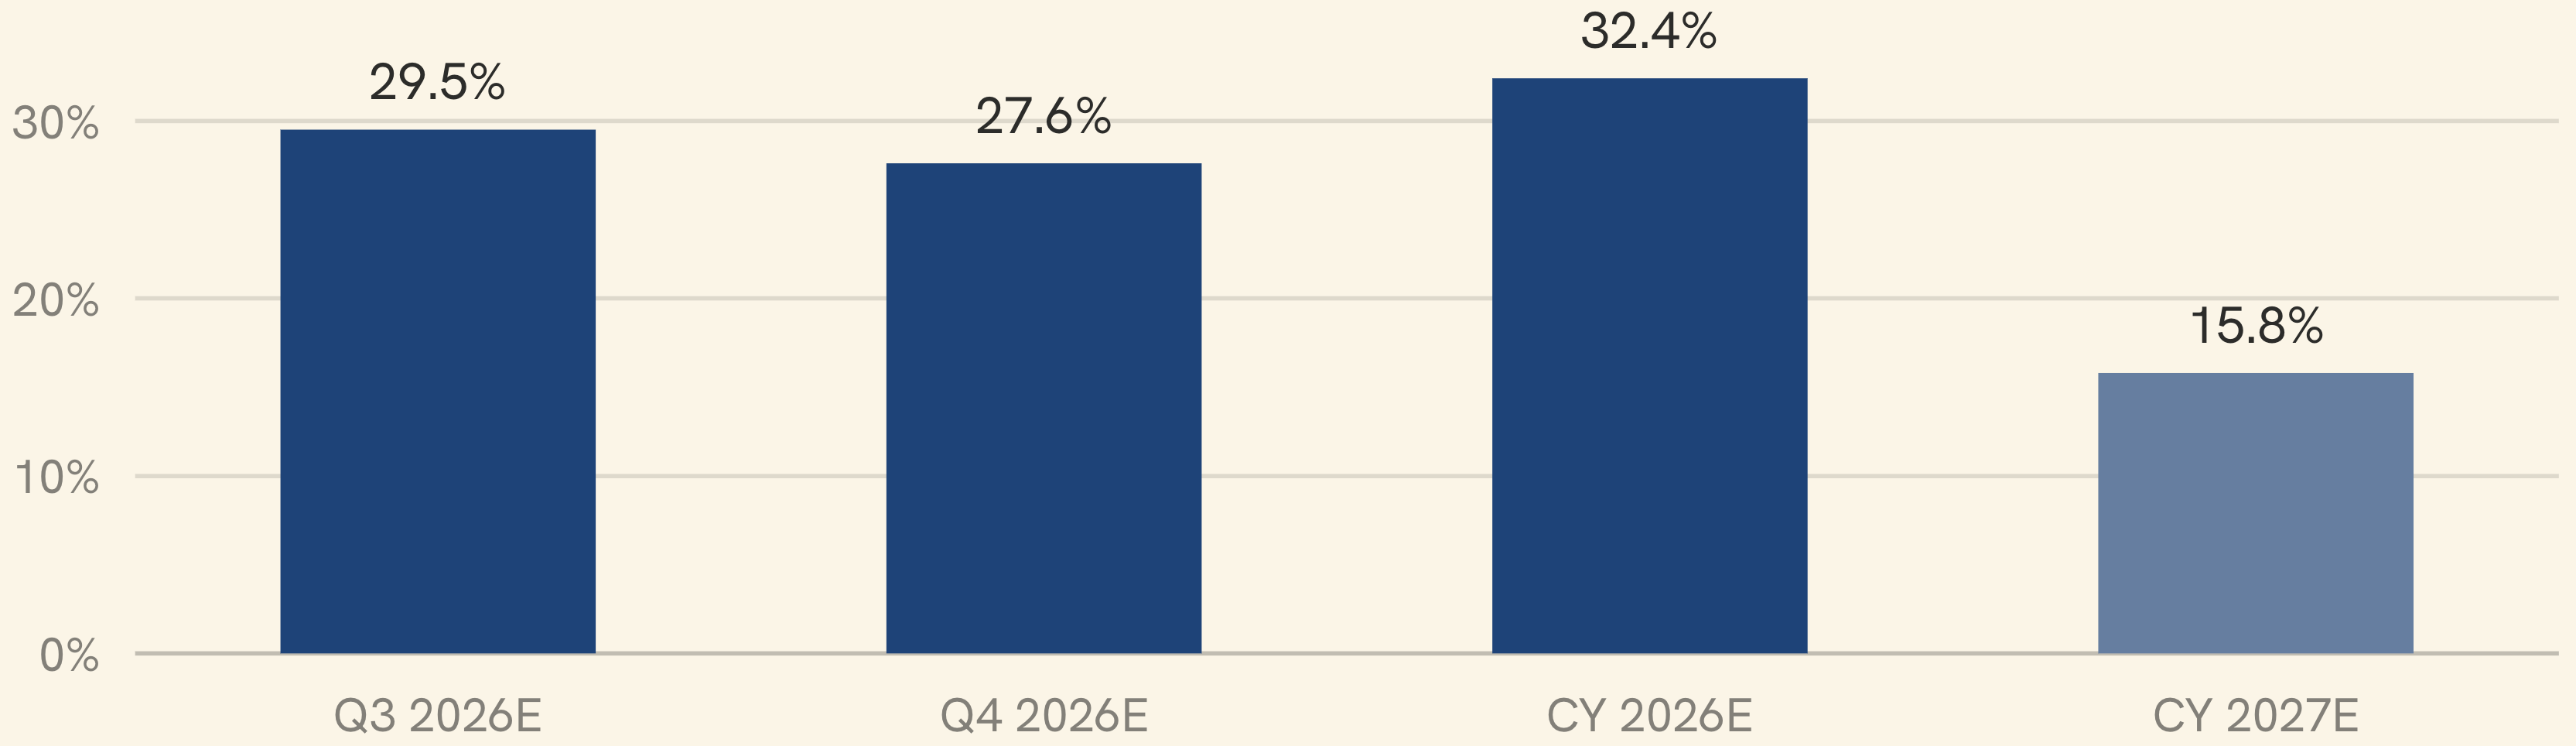
Despite the move in rates, U.S. stocks finished the quarter higher. The S&P 500 gained 2.0% in the third quarter and, at the time of this writing, sits near 7,800, just below the record high it set on October 6.3 The widely held assumption is that the engine is earnings. According to FactSet, analysts expect third-quarter profits for the index to grow 29.5% from a year earlier, up from 26.7% expected on June 30 – an upward revision during a quarter, which is unusual: analysts typically trim their estimates as a quarter unfolds, so a rising number means companies have been outrunning expectations.17 For calendar 2026, the estimate is now 32.4%; for 2027, 15.8%.17
Those numbers have done something valuations rarely manage during a rally: they have made the market relatively cheaper. FactSet puts the forward 12-month price-to-earnings ratio at 19.0, below the 20.4 recorded on June 30 and below both its five-year and 10-year averages.17 Profits grew faster than prices, which we think is the healthy way for a multiple to compress.
The catch is concentration. Morningstar data show the equal-weighted S&P 500 actually fell 1.5% in the quarter, while three companies – Nvidia, Apple, and Microsoft – now make up roughly a fifth of the index.3,18 We believe in artificial intelligence as a longer-term tailwind for companies, and therefore for earnings and for the market. While recognizing that the magnitude and timing of those benefits remain uncertain, we have no interest in standing on the sidelines of it. At the same time, there are legitimate concerns about the sheer amount of spending in that space in such a short period of time, and in our view an index carried by so few names is less sturdy than its performance suggests. If 2027 earnings arrive near the 15.8% analysts expect, stocks could grind higher even with 5% Treasuries; if estimates come down, there is less room than usual to absorb the news. Hence our neutral weight: invested, but not leaning in.
A Mosaic of Excess
None of the following is a forecast. Each is a small tile, and it is the mosaic they form that gives us pause. At Keeneland’s September sale in Kentucky – the thoroughbred industry’s largest annual auction of yearlings, one-year-old racehorses that have never raced – buyers paid a record $536.7 million, with 70 horses fetching $1 million or more, up from 56 a year earlier.19 At Monterey Car Week in August, collector-car auctions totaled roughly $756 million, up from $433 million in 2025, according to Hagerty, the insurer and data provider that tracks the collector-car market; a 1964 Shelby Cobra, one of the most sought-after American sports cars ever built, sold for $42.9 million.20 In the art market, first-half 2026 auction sales at Christie’s, Sotheby’s, and Phillips reached $6.8 billion, up 70% from the first half of 2025, according to ArtTactic, a firm that analyzes the art market.21 And bitcoin, near $83,000, sits a third below last October’s record yet far above where it stood a few years ago.22
To be fair, each of these markets has its own story. But when racehorses, collector cars, paintings, and crypto all clear at once, this may indicate elevated investor risk appetite in various markets with their own supply and demand dynamics. In our experience that rarely marks the beginning of a cycle. We are not trying to guess when it ends, but we are cognizant of these seemingly disparate data points when assessing potential exuberance in asset prices.
Illiquidity in Private Assets and Their Valuations
While private equity, private credit, and private real estate have earned their place in many portfolios over the long run, we think this is a moment to favor assets that can be sold quickly when necessary over assets that are more difficult to sell in a pinch. The reason is price discovery – the process by which willing buyers and sellers reveal what something is actually worth – and in private markets it appears to have slowed considerably.
Private funds normally return cash to their investors by selling the companies they own; with those sales muted, investors who need liquidity are increasingly selling their stakes in the funds themselves to other investors, in what is called the secondary market. Jefferies reports that such trading hit a record $118 billion in the first half, and that buyers paid an average of 91 cents on the dollar of the funds’ stated net asset value.23 That 9% haircut is not unusually steep – buyout stakes have changed hands at 91 to 94 cents on the dollar in each of the past three years – which makes the record volume the more telling number: more owners are accepting a discount to get out.24 Meanwhile the inventory of companies owned by private equity funds has swelled to 13,509, and Cherry Bekaert notes that sponsors “appear willing to wait rather than accept the discount secondary buyers demand.”25 In our eyes, waiting is a signal in itself: a seller who declines a bid may believe the asset is worth more, but a value is only established where a buyer and a seller actually agree, and until that happens the bid is the only price anyone has put on the table.
There is a further reason sponsors are slow to sell, and in our view it deserves more attention than it gets. Private funds carry their holdings at estimated values that are updated only periodically, and an actual sale is the hardest evidence of what an asset is worth. If a fund sells a company or a building below the value it has been carrying, that price becomes a reference point that auditors and valuation committees can be expected to apply to similar holdings, potentially pulling down marks across the portfolio. The incentive therefore runs toward holding on and hoping values recover enough for sales to resume. The data suggest that is what is happening: Bain & Company reports that buyout funds’ distributions to investors have run below 15% of net asset value for four consecutive years, an industry record, that holding periods at exit have stretched to about seven years from five or six over the prior decade, and that funds worldwide are sitting on roughly 32,000 unsold companies – while the sales that do occur still tend to fetch a premium to the fund’s own mark, consistent with funds selling what they can sell well and holding what they cannot.26 For investors in these funds, the practical consequence is less visibility into what the remaining holdings are worth.
Private credit gave us a preview of what that can mean in April. When investors asked to withdraw 22% of Blue Owl’s flagship credit fund and 41% of its technology lending fund in a single quarter, the firm capped redemptions at 5%; in October it capped them again, with requests at the technology fund still running at 39%.27 Starwood’s $22 billion real estate income trust suspended most redemptions the same month and cut its distribution, with its chairman writing that “now is not the time to force sales.”28 These episodes are concentrated in particular strategies, and they are not defaults. But credit sits above equity in the capital stack, meaning lenders are paid before owners are, so when the senior layer is being repriced, we think the equity beneath it is unlikely to have escaped. Our position is not that private assets are bad; many may deliver strong returns over a full cycle. It is that an investor is being asked to accept less liquidity at a moment when the marks may be less reliable than usual.
Where We Stand
- Equities at a neutral weight. In general, we maintain a neutral weight to equities. We view the earnings as real, as we do the AI tailwind, and in our view that warrants continued exposure to equities.
- Take the income, mind the maturity. With the 10-year above 5%, high-quality bonds appear to be paying investors a healthier return for the risk they carry. For clients whose investment objectives and risk tolerance lean toward a heavier bond allocation, we favor adding some degree of exposure to floating-rate and inflation-protected fixed income. In general, we are not selling shorter bonds to move into the longest maturities; this quarter’s 8.0% loss on long Treasuries is a reminder of what the cost can be when rates rise.12
- Favor liquid over illiquid. For the most part, we are not adding to private equity, private credit, or non-traded real estate while price discovery in those markets remains impaired.
- Rebalance the winners. The handful of companies that carried the index this year have grown well past their target weights in many portfolios. Trimming them back to policy is not a market call; we think it is the discipline that can help build the cushion for the next drawdown.
Our base case for the quarter ahead is an economy that keeps growing slowly, inflation that eases without disappearing, and a Fed that moves once more before standing still. In that scenario, we believe it is most likely that investors would expect modestly positive returns from a diversified portfolio. We remain focused on earnings, potential AI tailwinds, and inflationary risks. We are neither very bullish nor very bearish on markets at this time.
If your situation has changed – a liquidity event, a shift in goals, a new obligation – then let’s talk. Please reach out to Ryan Tunnell at Kento Wealth Advisors of Maeder Wealth Group at [email protected], and we will discuss your particular circumstances.
Every figure in this outlook is anchored to a dated, third-party source. Market levels are as of October 7, 2026 unless noted and are subject to revision.
- Yahoo Finance, Oct. 7, 2026 — 10-year yield touched 5.36%, its highest since April 2002; 30-year 5.73%, highest since May 2002. CNBC, Sept. 25, 2026 — 10-year at its highest since June 2007.
- Federal Reserve, FOMC statement and Summary of Economic Projections, Sept. 16, 2026 — target range raised 25 basis points to 3.75%–4.00% by a 12–0 vote, the first increase since 2023; 16 of 18 participants expected at least one more increase in 2026; median projection 4.1% at end-2026 and end-2027; federalreserve.gov. CNBC and Charles Schwab, Sept. 16, 2026 — Chair Warsh: inflation “is too high and has been for too long.”
- CNBC, Sept. 30, 2026 — S&P 500 closed the quarter at 7,651.54, +2.0% for the quarter. Dow Jones Market Data via Morningstar, Oct. 1, 2026 — record close 7,798.99 on Aug. 13. Yahoo Finance, Oct. 7, 2026 — close of 7,801.77 after record highs on Oct. 6; Nvidia, Apple, and Microsoft together account for roughly a fifth of the index.
- U.S. Bureau of Labor Statistics, Consumer Price Index, August 2026 (Sept. 11, 2026) — all items +0.4% for the month and +3.4% over 12 months; core +0.3% and +2.4%, the smallest 12-month core increase since March 2021; gasoline +27.4% over 12 months; bls.gov; CNBC.
- U.S. Energy Information Administration, Short-Term Energy Outlook, October 2026 — Brent spot averaged $114 per barrel in September and reached $131 on Sept. 15 after the attack on Saudi Arabia’s East-West pipeline; EIA projects Brent near $105 in the fourth quarter. Trading Economics and Yahoo Finance, Oct. 7, 2026 — Brent near $101.
- U.S. Department of the Treasury, Daily Treasury Par Yield Curve Rates — June 30 and Sept. 30, 2026: 10-year 4.44% → 5.29%; 2-year 4.14% → 4.88%; 30-year 4.91% → 5.64%; 3-month 3.87% → 4.20%; home.treasury.gov.
- Federal Reserve, minutes of the Sept. 15–16 FOMC meeting (Oct. 7, 2026) — “most participants assessed that another increase … would likely be appropriate by year end”; Yahoo Finance — futures priced roughly 17% odds of an October hike after the September jobs report.
- Trading Economics, Oct. 7, 2026 — the 10-year yield is up more than 110 basis points this year as the risk of higher Fed rates, deficit spending and heavy debt supply reduced demand for longer-dated bonds. CNBC, Sept. 25, 2026 — yields rose on hawkish Fed commentary, elevated oil prices and a strong purchasing managers’ survey.
- Board of Governors of the Federal Reserve System, 10-year Treasury constant-maturity yield, monthly averages (GS10), via FRED, Federal Reserve Bank of St. Louis, Oct. 7, 2026 — September 2026 average 4.99%, the first monthly average near 5% since July 2007; period averages (5.79% for 1990–2007; 2.28% for 2009–2021) computed from the same series.
- U.S. Bureau of Economic Analysis, Personal Income and Outlays, August 2026 (Sept. 30, 2026) — PCE price index +3.4% and core PCE +3.0% over 12 months; bea.gov; Trading Economics.
- Institute for Supply Management, Manufacturing PMI, September 2026 (Oct. 1) — headline 54.5; prices index 77.9, up from 71.1 in August; via First Trust Portfolios.
- Morningstar, “How Bond Funds Performed in Q3 2026” (Oct. 1, 2026) — third-quarter total returns: Morningstar US Core Bond Index −3.4%; US 10+ Year Treasury Bond Index −8.0%; US Municipal Bond Index −5.9%; US High Yield Bond Index −1.8%; Morningstar LSTA US Leveraged Loan Index +2.0%, the only major bond sector positive for the quarter.
- ICE U.S. Treasury 1–3 Year Bond Index, three months to Sept. 30, 2026 — total return −0.17%; via iShares (BlackRock), performance as of Sept. 30, 2026.
- ICE U.S. Treasury Inflation Linked Bond Index and ICE U.S. Treasury 0–5 Year Inflation Linked Bond Index, three months to Sept. 30, 2026 — total returns −3.23% and −0.67%; via iShares (BlackRock), performance as of Sept. 30, 2026.
- U.S. Bureau of Labor Statistics, The Employment Situation — September 2026 (Oct. 2, 2026) — payrolls +29,000 versus 84,000 expected (CNBC); unemployment rate 4.2%; average hourly earnings +3.0% over 12 months; prior two months revised down by 60,000; bls.gov; Bloomberg.
- U.S. Bureau of Economic Analysis, GDP (Third Estimate), second quarter 2026 (Sept. 30, 2026) — real GDP +2.2% at an annual rate, revised up from 1.5%; bea.gov.
- FactSet, Earnings Insight and “S&P 500 Earnings Season Preview: Q3 2026,” Oct. 2, 2026 — estimated Q3 earnings growth 29.5% (26.7% on June 30); calendar 2026 32.4%; calendar 2027 15.8%; forward 12-month P/E 19.0, below the five-year (19.8) and 10-year (19.1) averages and below 20.4 on June 30.
- Morningstar via Dalton Financial, “Third Quarter 2026 Market Update” — S&P 500 Equal Weight index −1.5% in the third quarter.
- Keeneland Association, September Yearling Sale results, Sept. 26, 2026 (via Briefs, Oct. 1, 2026) — gross $536.7 million, a record; 70 yearlings at $1 million or more versus 56 in 2025.
- Hagerty, Monterey Car Week 2026 auction results, Aug. 2026 — about $756 million in sales versus $432.7 million in 2025 and the prior record of $471 million in 2022; a 1964 Shelby Cobra Daytona Coupe sold for $42.9 million; via Artnet News and First Trust Portfolios.
- ArtTactic, via The Art Newspaper, July 10, 2026 — auction sales at Christie’s, Sotheby’s, and Phillips of $6.8 billion in the first half of 2026, up 70% from a year earlier and the strongest first half since 2022.
- Yahoo Finance and Fortune, Oct. 7, 2026 — bitcoin near $83,000, about 31% below a year earlier; OKX — record high $126,200 on Oct. 7, 2025.
- Jefferies, Global Secondary Market Review, July 2026 — first-half 2026 secondary volume a record $118 billion, “due to muted private equity exits”; buyout fund interests priced at 91% of net asset value on average.
- Jefferies, Global Secondary Market Review, January 2024, January 2025 and 2025 annual review — average secondary pricing for buyout fund interests of 91% of net asset value in 2023, 94% in 2024 and 92% in 2025; H1 2026 pricing described as “near historically elevated levels.”
- Cherry Bekaert, “U.S. Private Equity at Mid-year 2026” (Aug. 2026) — inventory of private-equity-backed companies 13,509 at the end of the second quarter; sponsors “appear willing to wait rather than accept the discount secondary buyers demand.”
- Bain & Company, Global Private Equity Report 2026 (March 2026) and Private Equity Midyear Report 2026 (June 2026) — distributions to limited partners below 15% of net asset value for four consecutive years (about 14% in 2025, a level last seen in 2008–09); average holding period at exit about seven years versus five to six in 2010–2021; roughly 32,000 unsold companies worth $3.8 trillion; exit activity “held back by market disruption and uncertainty over valuations”; the premium above carrying marks that buyers have historically paid on exit “does not appear to have gone away.”
- Bloomberg and CNBC, April 2, 2026 — Blue Owl Capital limited redemptions at 5% a quarter after investors asked to withdraw 21.9% of its Credit Income Corp. and 40.7% of its Technology Income Corp. Bloomberg, Oct. 2, 2026 — both funds capped again; third-quarter requests at the technology fund were 39%.
- CoStar News, Bisnow and AltsWire, April 30, 2026 — Starwood Real Estate Income Trust ($22.4 billion of property) suspended most share repurchases and cut its distribution rate to 4.7% from 6.3%; its chairman wrote that “now is not the time to force sales.”
Forward-looking statements. Statements about the economy, markets, and portfolio positioning are based on assumptions and current expectations, involve known and unknown risks and uncertainties, and may not come to pass. Actual results may differ materially. The practice undertakes no obligation to update any forward-looking statement.
Data & sources. Figures are drawn from the third-party sources cited on the preceding page and are believed to be reliable as of October 7, 2026, but their accuracy and completeness are not guaranteed. Economic and market data are subject to revision. Charts are drawn from the cited data; period averages were computed from the cited series.
Risk. All investing involves risk, including the possible loss of principal. Past performance is not a guarantee of, and may not be indicative of, future results. Diversification and asset allocation do not ensure a profit or protect against loss in a declining market. Fixed-income investments are subject to interest-rate, credit, and inflation risk; bond prices generally fall as rates rise. Floating-rate loans are generally rated below investment grade and carry credit and liquidity risk. Private equity, private credit and non-traded real estate are illiquid, may restrict redemptions, and may be valued infrequently. Investments in commodities, energy and digital assets may be more volatile than other investments.
Confidentiality. Prepared for clients of Kento Wealth Advisors. Please do not redistribute.
S&P 500 Index is a capitalization-weighted index calculated on a total return basis with dividends reinvested. The index includes 500 widely held U.S. market industrial, utility, transportation and financial companies. The S&P 500 Equal Weight Index includes the same companies, each at an equal weight.
Nasdaq Composite Index is a market-capitalization-weighted index of the common stocks listed on the Nasdaq Stock Market. Dow Jones Industrial Average is a price-weighted index of 30 large U.S. companies.
Morningstar US Core Bond Index measures the U.S. dollar-denominated, investment-grade, fixed-rate, taxable bond market, including Treasuries, government-related, corporate and securitized bonds. Morningstar US 10+ Year Treasury Bond Index measures U.S. Treasury securities with maturities of 10 years or more. Morningstar US High Yield Bond Index measures U.S. dollar-denominated corporate bonds rated below investment grade. Morningstar US Municipal Bond Index measures the U.S. investment-grade, tax-exempt municipal bond market.
ICE U.S. Treasury 1–3 Year Bond Index measures U.S. Treasury securities with remaining maturities between one and three years. ICE U.S. Treasury Inflation Linked Bond Index measures U.S. Treasury Inflation-Protected Securities of all maturities; ICE U.S. Treasury 0–5 Year Inflation Linked Bond Index measures those with remaining maturities of five years or less. Morningstar LSTA US Leveraged Loan Index is a market-value-weighted index of the U.S. institutional leveraged loan market; loan coupons float with short-term interest rates. Indices are unmanaged and cannot be invested in directly; index returns do not reflect fees or expenses.
Wells Fargo Advisors Financial Network did not assist in the preparation of this report, and its accuracy and completeness are not guaranteed. The report herein is not a complete analysis of every material fact in respect to any company, industry or security. The opinions expressed here reflect the judgment of the author as of the date of the report and are subject to change without notice. Any market prices are only indications of market values and are subject to change. The material has been prepared or is distributed solely for information purposes and is not a solicitation or an offer to buy any security or instrument or to participate in any trading strategy. Additional information is available upon request.
Investment products and services are offered through Wells Fargo Advisors Financial Network, LLC (WFAFN), Member SIPC. Kento Wealth Advisors of Maeder Wealth Group is a separate entity from WFAFN.